Instacart Market Basket Analysis
Challenge description stolen shamelessly from Kaggle:

Problem Statement:
Given a user’s order history on the Instacart platform, can we accurately predict which items that user will reorder during their next session?
But why does that matter?
If Instacart can accurately predict this, it could potentially yield multiple benefits to both the user and Instacart.
- First, Instacart can add functionality to automatically add suggested items to user’s carts. This can reduce friction for users during the order process, potentially increasing overall satisfaction.
- Second, it can be used as an additional point of engagement. Combined with order frequency analysis, this can act as a reminder that it’s not only time to purchase necessities, but which necessities to buy.
Data:
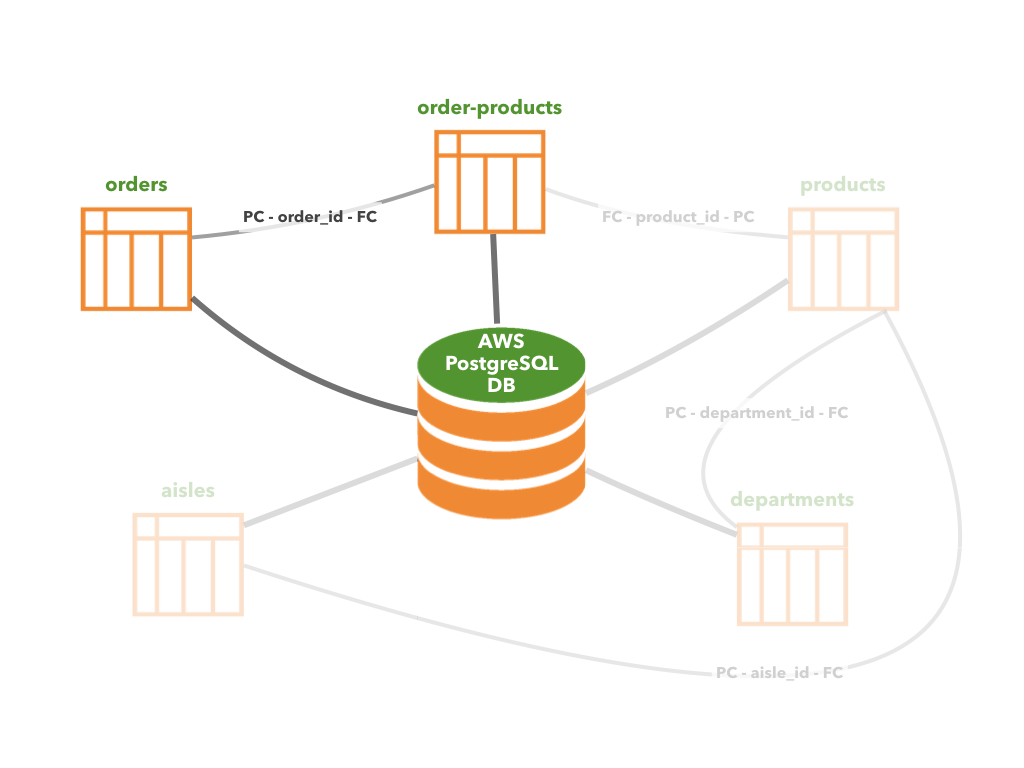
The data for this challenge is freely available on Kaggle. While doing this project, I stored the data in a PostreSQL database hosted on an AWS server where I also did all of my modeling.
Schema:
Instacart provided a bunch of tables but I only really need to work with these two:

A quick look at the tables:


Feature engineering:
What sorts of features are we going to make?
Do we want to make features for users?

How about for specific products?

Or maybe we want to make user-product features… Features that are specific to both a user and a product…

How about all three?
It ultimately turned out while doing feature engineering that certain features provide the most signal when for specific users while some data was too sparse for some features and thus it was better aggregated across all users.
There were also features specific to users (like their order frequency) which had nothing to do with the particular products that they ordered but still provided additional signal!!
Let’s get to making features!
Many features for this dataset were actually quite intuitive. The first step in feature engineering during this project was merely to think about what behavior I exhibit with items that I frequently repurchase (and inversely, what behavior do I exhibit with things that I don’t buy frequently).
Almost painfully obvious is the number of times each user has bought something. If I’ve purchased something every time I’ve used the Instacart platform, I’m probably going to purchase it again.
While that is a great feature, we’re only looking at things in terms of individual users… How about we also think about the number of times a product has been ordered across all users. If lots of people buy bananas and the people who’ve bought bananas keep buying banana and I bought bananas last time… Does that mean I’m likely to buy bananas again? According to the model (and our results): yes.
Additionally, if we always run over to produce and buy apples, oranges, and bananas (i.e. low/early add_to_cart_order), it’s probably a pretty high priority item.
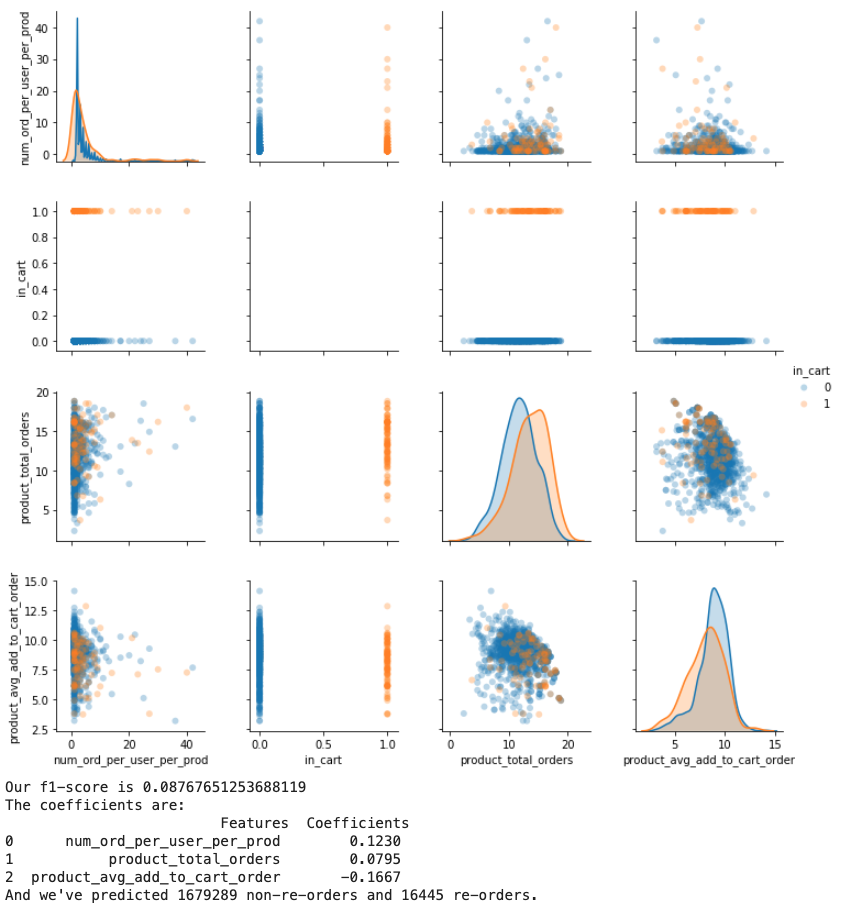
Below you can see a pairplot with those features. Things to look for? Separation in our distributions (down the diagonal) and higher absolute values of our coefficients.

Some were a little less intuitive. Instacart provided the departments for each product. You might think that taking the average reorder rate for products by department would add signal but it actually just added noise and didn’t improve the model.
Ranking reorder rate and creating ordinals added slightly more signal but the most effective use of departments that I discovered actually turned out just to create a column indicating the most positively correlating departments with reorders with a 1, the least correlating departments with a -1 and making everything else 0 essentially removing all of the noise in the middle.
Modeling:
How do we evaulate our models?
The decision was made for me: f1-score. An f1-score is the harmonic average of the precision and recall, where an F1 score reaches its best value at 1 (perfect precision and recall) and worst at 0.
However, we don’t need to blindly listen to what the Kaggle website tells us to do; we can think through this ourselves and understand why this makes sense as an evaluation metric.
Thinking about this from the user perspective, what does a false positive look like? Maybe this tool gets implemented in such a way that users receive an email allowing the option to automatically add suggested items to their cart with the click of a button.
False positives would be annoying, something is automatically added to the cart that you don’t even want, and now you need to remove it!
False negatives are simply a missed opportunity to have positive engagement with users, facilitate their experience, and possibly increase retention.
Which models and why:
When it came to choosing which models to test I wasn’t picky or partial to any in particular models.
I started with logistic regression as I’d been using coefficients to determine feature importance. Out of the box, its f1-score was 0.250; quite low! After scaling the data, it was bumped up slightly to 0.267.
Random Forest performed slightly better than our logistic regression with an f1-score of 0.278.
When it came to Naive Bayes I tested all models, but there was only ever one real possibility: Gaussian Naive Bayes. Gaussian Naive Bayes was great for this dataset as almost all features were continuous and had Gaussian distributions. It gave an f1-score of 0.400.
Now I have all of these extras models… Gaussian Naive Bayes was far better than the other models, but perhaps they still add some signal. Is there anything we can due to include that signal in our predictions?
Yes, with an ensemble!
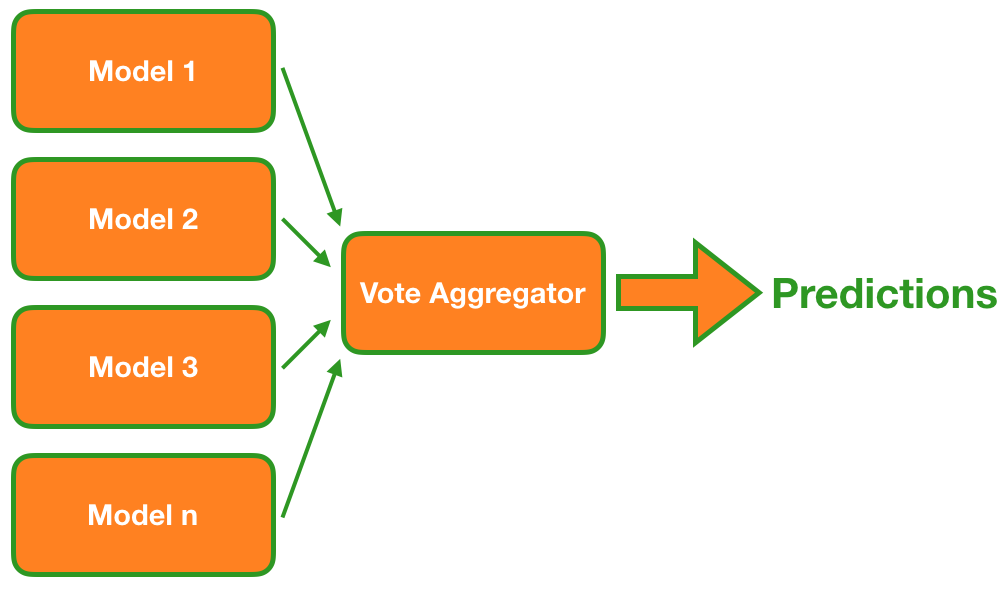
I simply took the predictions of 9 different models that I created, and if more than half voted for an option, I went with that option!

Some interesting challenges:
- KFold cross-validation: As we’re trying to predict future behavior on the user level we need to be careful when it comes to how we split out data. We can’t use a simple random split as this will result in previous orders from validation users making their way into the training set. To solve this, I had to be careful to make sure I split on
user_id:def kfold_val_fit_score_pred_G_NB(df, val_size=.2, seed=42): df = df.drop(['product_id', 'latest_cart'], axis=1) ids = pd.DataFrame(df.user_id) kf = KFold(n_splits=5, shuffle=True, random_state = seed) model_results = [] # collect training and validation results for train_ids, val_ids in kf.split(ids, ids): X_train, y_train = df.iloc[train_ids], df.iloc[train_ids] X_val, y_val = df.iloc[val_ids], df.iloc[val_ids] X_train = pd.DataFrame(X_train).drop(['in_cart', 'user_id'], axis=1) y_train = pd.DataFrame(y_train).in_cart X_val = pd.DataFrame(X_val).drop(['in_cart', 'user_id'], axis=1) y_val = pd.DataFrame(y_val).in_cart clf = GaussianNB(var_smoothing=1e-20) clf.fit(X_train, y_train) vals = pd.DataFrame(clf.predict(X_val))[0].value_counts() model_results.append(f1_score(clf.predict(X_val), y_val)) print('Individual f-1 score: ', model_results) print(f'Average f1-score: {np.mean(model_results):.3f} +- {np.std(model_results):.3f}')
Future work:
- Implementing a version of GridSearch that splits on
user_idthe same way I did in KFold cross-validation. - Employing models such as XGBoost which would have required a new version of GridSearch that split on
user_id.
Tools:
- Python, Jupyter, Pandas, Numpy - Ingest, organize, and process data
- sklearn - Various models and tools including logistic regression, Naive Bayes classifiers, random forest, etc.
- Matplotlib/Seaborn - Data Visualization