Predicting Brewery Scores on BeerAdvocate.com
Problem Statement
I approached this project from the perspective of having been contracted by a local brewery seeking to increase their score on BeerAdvocate.com. Social media is a concern for many small business owners so it is fair to assume that a regional or up-and-coming brewery would be concerned with their score on such a platform. The ultimate takeaway for breweries will be informing them about which factors to consider that will allow them to optimize their score effectively.
Gathering Data:
Using BeautifulSoup4, I collected data from BeerAdvocate.com for all breweries (+14k) and beers (+250K).
Beer Information - Features for the +250k beers:
- Beer Name: Serves as an index only while pulling data.
- Brewery Name: Serves as an index when combining beer data with brewery data.
- ABV: Alcohol content of the beer.
- Ratings: Number of ratings for the beer.
- Score: Average of ratings for the beer
- Brewery Number: Used later as part of the URL for gathering brewery information.
Brewery Information - Features for the +14k breweries:
- Score: The average of all beers with ratings for that brewery
- Brewery Class: Categorical ranking of Brewery. Outstanding, Good, Okay, etc.
- Number of Beers: The number of beers produced by the brewery and listed on beer advocate.
- Town: The town of the brewery. (This will return city for international breweries).
- State/Region: The state of where the brewery. (This will return country for international breweries).
- Country: The country of the brewery.
- Number of Beer Reviews: Total number of reviews for all beers for a brewery.
- Number of Beer Ratings: Total number of ratings for all beers for a brewery. (Note that reviews are different from ratings in the reviews include a text response while ratings are only numeric).
- Brewery Score: Our target. The average score across all ratings for a brewery.
- Reviews: The number of reviews for a brewery.
- Ratings: The number of ratings for a brewery. (Note that reviews are different from ratings in that reviews include a text response while ratings are only numeric).
- pDev: The percent deviation of ratings for a brewery.
- Brewery Type: The brewery type. Can include: Homebrew, Beer-to-go, Eatery, etc.
- Phone Number: Boolean used to indicate whether a brewery included their phone number of the brewery page.
- Notes: Boolean indicating whether the brewery contains notes. (May contain information regarding when it was acquired by another brewery, hours of operation, etc).
Which Breweries:
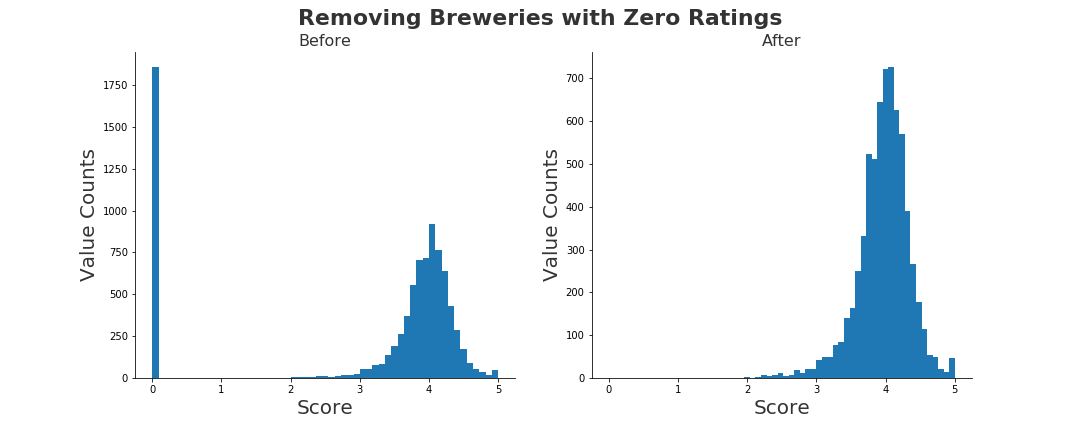
Due to varying regional preferences in beer styles and the fact that BeerAdvocate.com has a more significant presence in the US than abroad, I decided to focus on only US breweries. I also excluded any breweries with more than 300 ratings as I believe that smaller breweries were far more likely to be concerned with their score/presence on BeerAdvocate.com than major breweries. There was also a significant number of breweries that did not have any reviews, once removing these breweries from the dataset there was a Gaussian distribution of scores for the remaining breweries.

See reductions in the dataset as follows:
- 14,979 - Initial dataset
- 8631 - After removing breweries with
np.NaNratings - 6776 - After removing breweries with zero ratings
- 5366 - After removing breweries with greater than 300 reviews
While this significantly reduced my number of observations, I thought it necessary to provide the highest possible level of insight for my target market.
Data Engineering:
The majority of the information available on each breweries page provided little insight into their score. Initial models without feature engineering resulted in an adjusted r-squared of only approximately 0.092. As a result, the model required a significant amount of feature engineering. All of the below-engineered features were on a per-brewery basis.
- Total Number of Beer Reviews
- Standard Deviation of ABV
- Counts of Beer Styles
- Average Beer Score
- Average ABV
- Max Number of Beer Ratings Per Beer
- Highest/Lowest Average Score by Style
- Highest/Lowest Score for Any Beer
- Max/Min/Mean/Count by Beer Style Category
Taking a look at how our variables correlate:
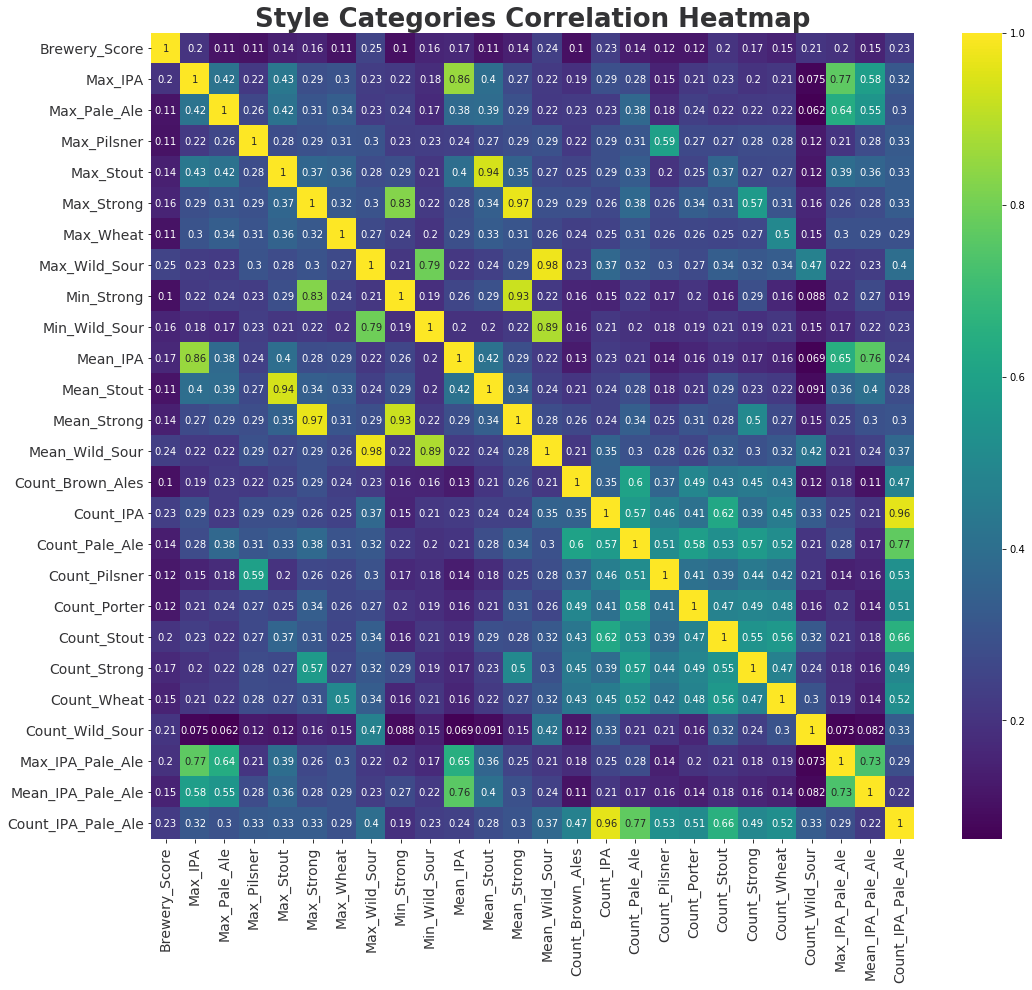
While the entirety of engineered features is too many to show; see below some of the more significantly correlating features derived from style categories. Our target, Brewery_Score, is in the first column. Notice that few features correlate significantly to our target. Also, note that there is some multicollinearity throughout the dataset which resulted in issues during the modeling process.

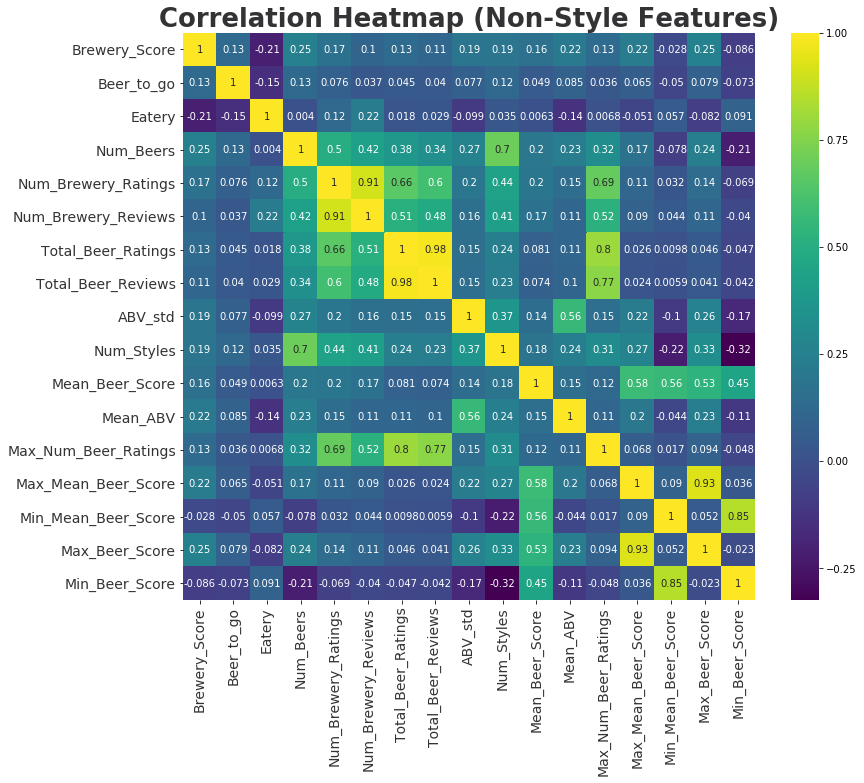
See below correlations for features other than those derived from beer style categories.

Refining Models:
While I had little hope that the original brewery features would yield positive results, I created a model using just those features as a baseline.
- Number of Beers
- Number of Brewery Ratings
- Number of Brewery Reviews
- Mean Beer Score
- Total Beer Ratings
The model produced an adjusted r-squared on the test data of 0.0919.
I then removed some of the poorly correlating features from the breweries dataset and incorporated some of the more highly correlating features taken from the beers dataset. This left me with the following features:
- Eatery
- Num_Brewery_Ratings
- Num_Brewery_Reviews
- Total_Beer_Ratings
- Total_Beer_Reviews
- Num_Beers
- Max_Beer_Score
- Max_Mean_Beer_Score
- Mean_Beer_Score
This brought the adjusted r-squared on the test data to 0.1456.
Implementing Ridge and LASSO with KFold CV:
Any OLS regression model should use only a small number of features. However, due to the fact the no few features were good predictors, I saw fit to use (and saw the best results using) a fairly significant number of features. Indicated below you can see any features that I transformed. Again, all features are per-brewery.
- Eatery - Boolean indicating whether the brewery is also an eatery.
- Lam_Total_Beer_Ratings - Box-cox transformation of Total Beer Ratings.
- Lam_Total_Beer_Reviews - Box-cox transformation of Total Beer Reviews.
- Lam_Num_Brewery_Ratings - Box-cox transformation of Number of Brewery Ratings.
- Lam_Num_Brewery_Reviews - Box-cox transformation of Number of Brewery Ratings.
- Num_Beers - Total number of beers.
- Max_Beer_Score - Highest beer score.
- Max_Mean_Beer_Score - Highest mean beer score for any style category.
- Mean_Beer_Score - Mean of all beer scores.
- Lam_Brew_Rats_Revs - Box-cox transformation of the number of brewery ratings multiplied by the number of reviews.
- Lam_Beer_Rats_Revs - Box-cox transformation of the number of beer ratings multiplied by the number of reviews.
- Max_Times_Mean_Beer_Score - Maximum beer score multiplied by the mean beer score.
- Count_IPA_Pale_Ale - The number of IPA and Pale Ales.
- Wild_Sour - Maximum wild/sour score multiplied by the mean wild/sour score.
Note that I used both Ridge and LASSO even though little to no overfitting was visible (i.e., there was little difference between the r-squared and RMSE for on the vanilla OLS model). Unsurprisingly, there was little difference between Vanilla OLS and the regularized models use Ridge and LASSO.
| Model / Metric | R2 | Adjusted R2 | RMSE |
|---|---|---|---|
| Vanilla OLS - No added features | 0.095 | 0.092 | 0.317 |
| Vanilla OLS | 0.209 | 0.1967 | 0.2922 |
| OLS Ridge | 0.209 | 0.1921 | 0.2924 |
| OLS LASSO | 0.210 | 0.1922 | 0.2922 |
Insights and Conclusions:
- Beer purists don’t like eateries - One of the more significant correlations, and by far the most significant negative correlation, was between a brewery’s score and whether or not it was an eatery.
- People like sours - Not only do people appreciate a good sour (i.e., a brewery will have a higher score if they’ve produced a good sour) but they’re more concerned with the quality (score) of a sour beer than the total number of sour beers. For sours - Quality over quantity.
- People like IPAs and Pale Ales - No surprise to anyone reading this but people like IPAs. However, unlike sours, the number of IPAs correlated more strongly to a brewery’s score than the quality (score) of those IPAs. For IPAs - Quantity over quality.
- More is better - Generally speaking, simply producing more beers is better for you brewery’s score.
- Good trumps bad - While the max score by brewery for a particular style category, or simply the max score across all beers, correlated significantly with a brewery’s score, the respective minimum scores did not. What this ultimately conveys is that a brewery should not be particularly concerned with whether they produce some beers that are flops/failures (i.e., low scoring beers) as the adverse effect seems somewhat insignificant.
Tools:
- Python, Jupyter, Pandas, Numpy - Ingest, organize, and process data
- BeautifulSoup4 - Data Gathering from various web sources
- Matplotlib/Seaborn - Data Visualization
Processes and Methods:
- Models - Ordinary Least Squares (OLS)
- Regularization Techniques:
- Ridge
- LASSO
- GridSearchCV
- KFold Cross Validation